Plotplot
Drag and drop plotting, data selection, and filtering

To install:
pip install plotplotEasy to use, scales to millions of rows.
Rows are data, columns are experiments
| Sequence | Binding | Transduction |
|---|---|---|
| SAQAQAQ | 0.1 | 0.231 |
| TTTQQQA | 5.12 | 4.1212 |
| AAATAAT | 0.32 | 0.5423 |
Single-cell data
Supports .h5ad files
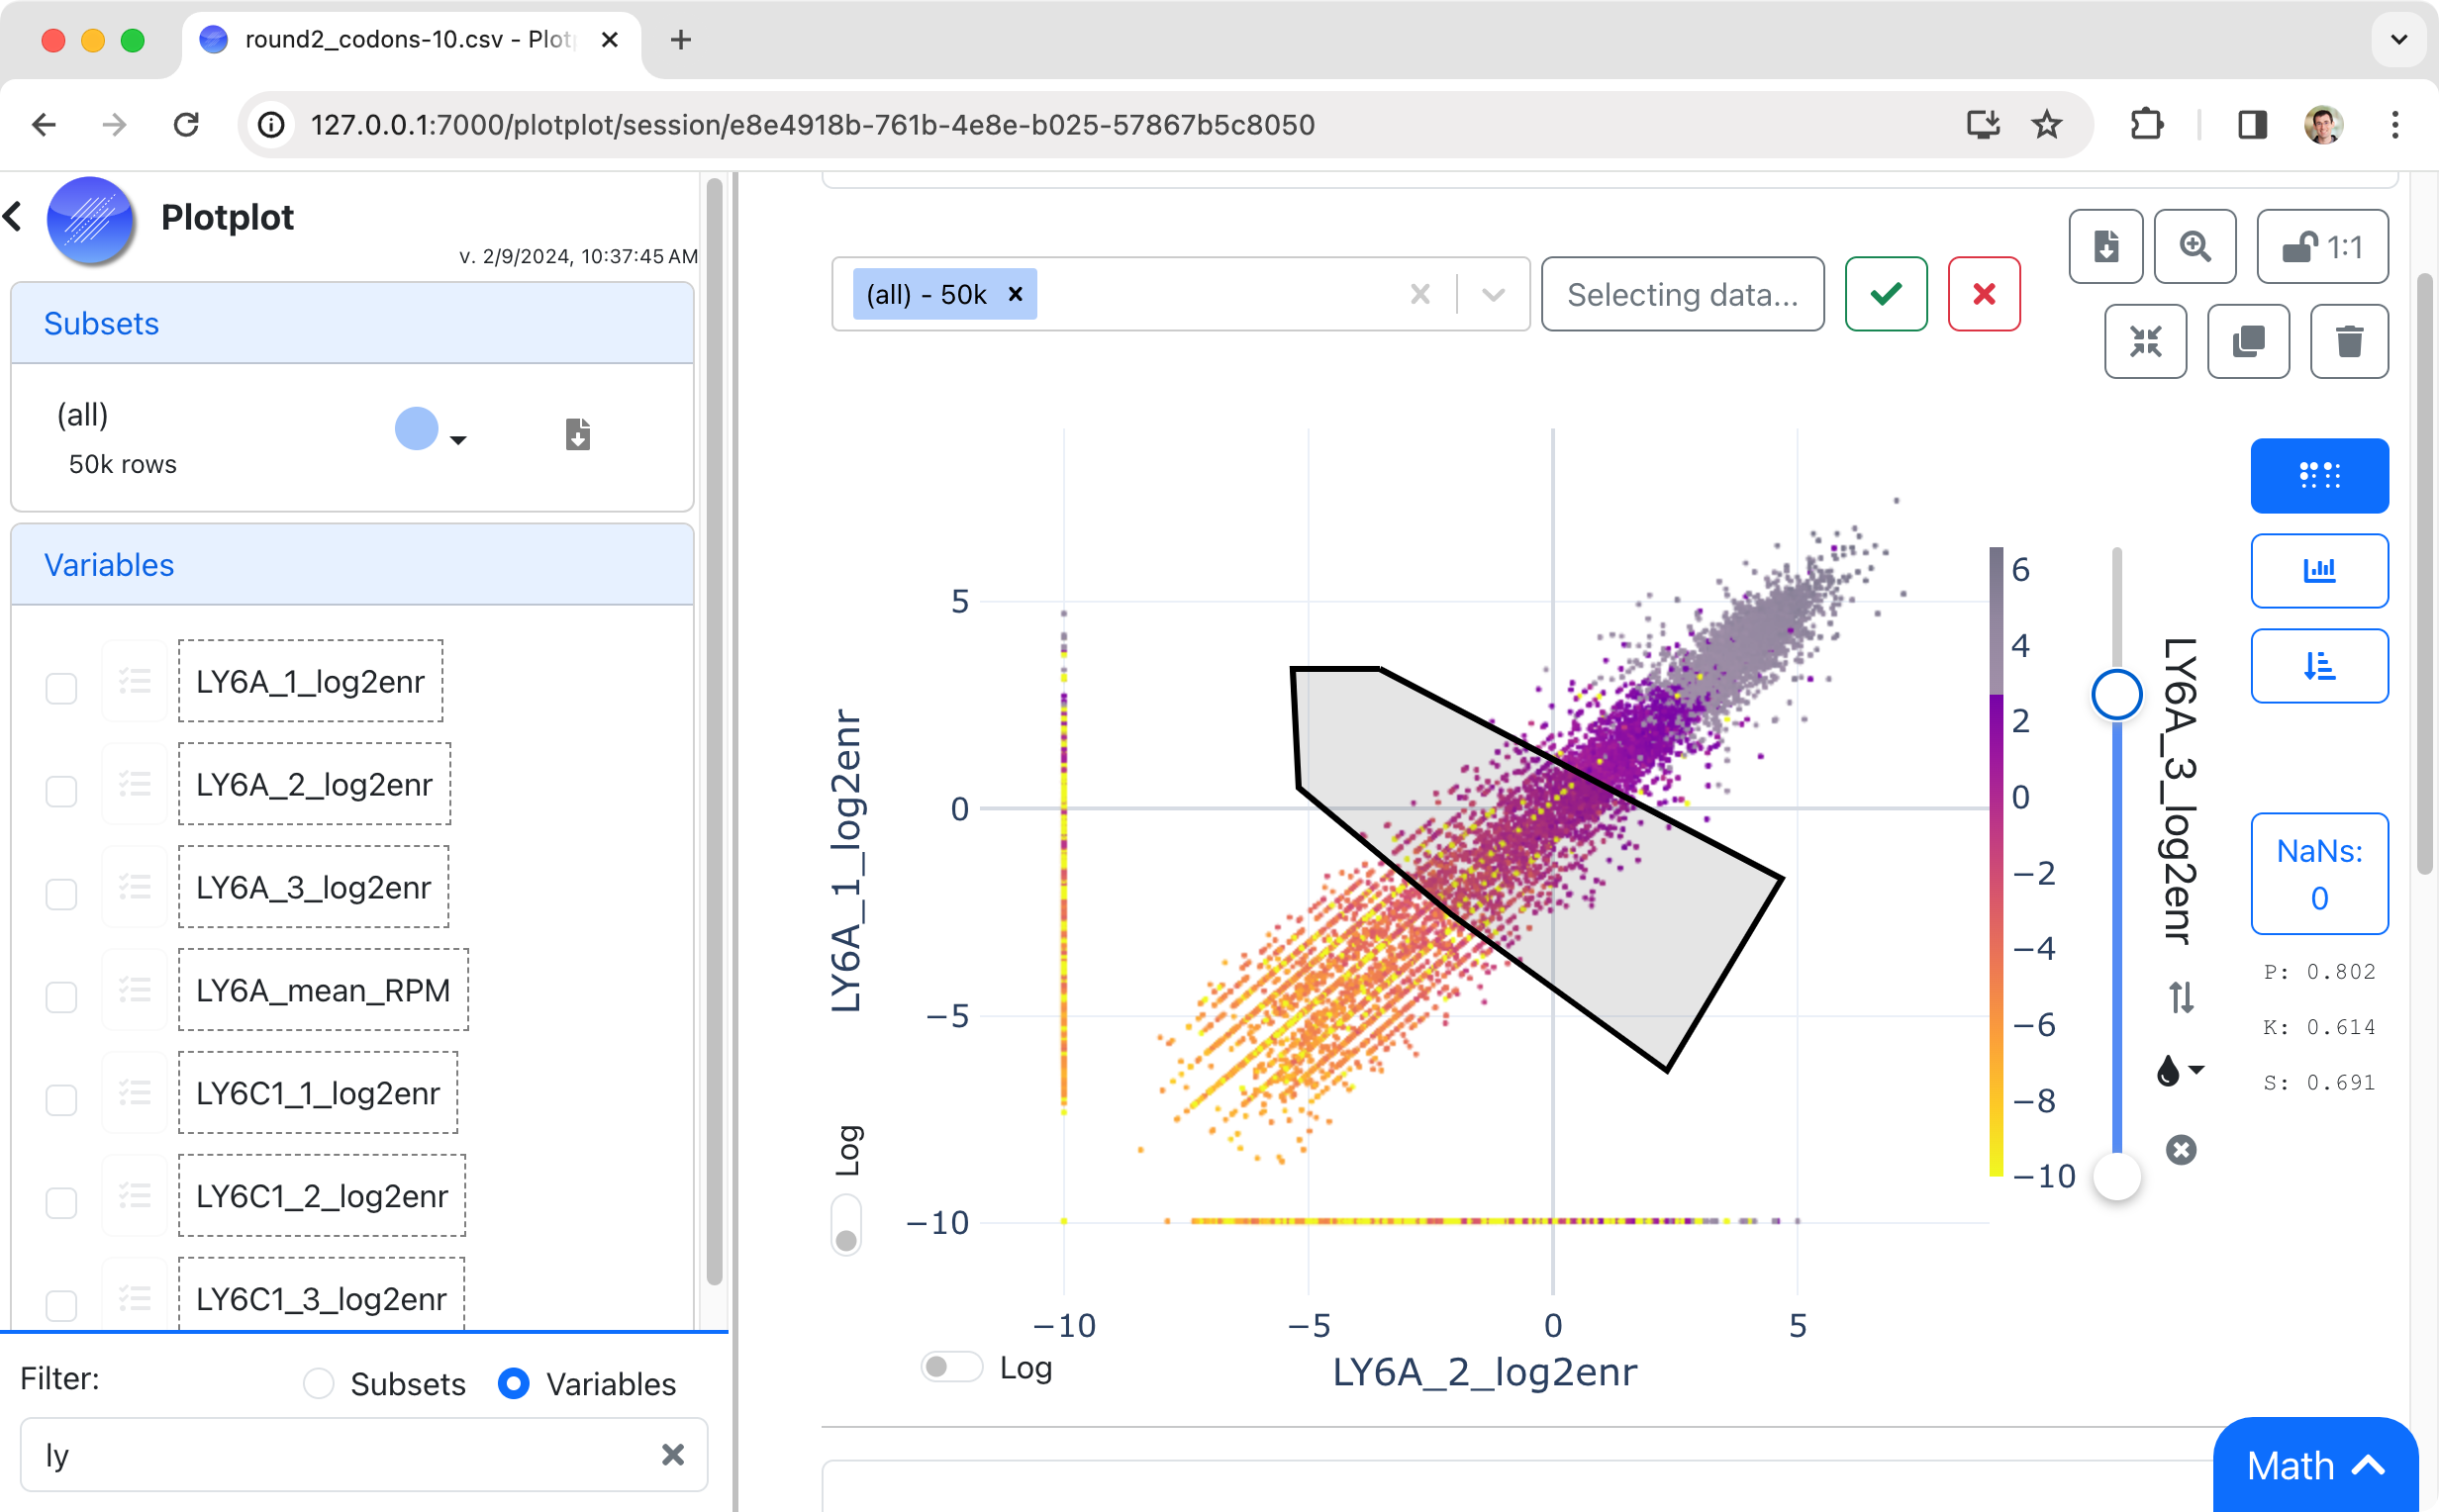
Drag-and-drop to graph
Columns of data are on the left, drag them to the X, Y, or Z axes to plot.
Always another graph
Scroll down, there's always another graph ready to go.